Your audience forgets videos.
They keep infographics.
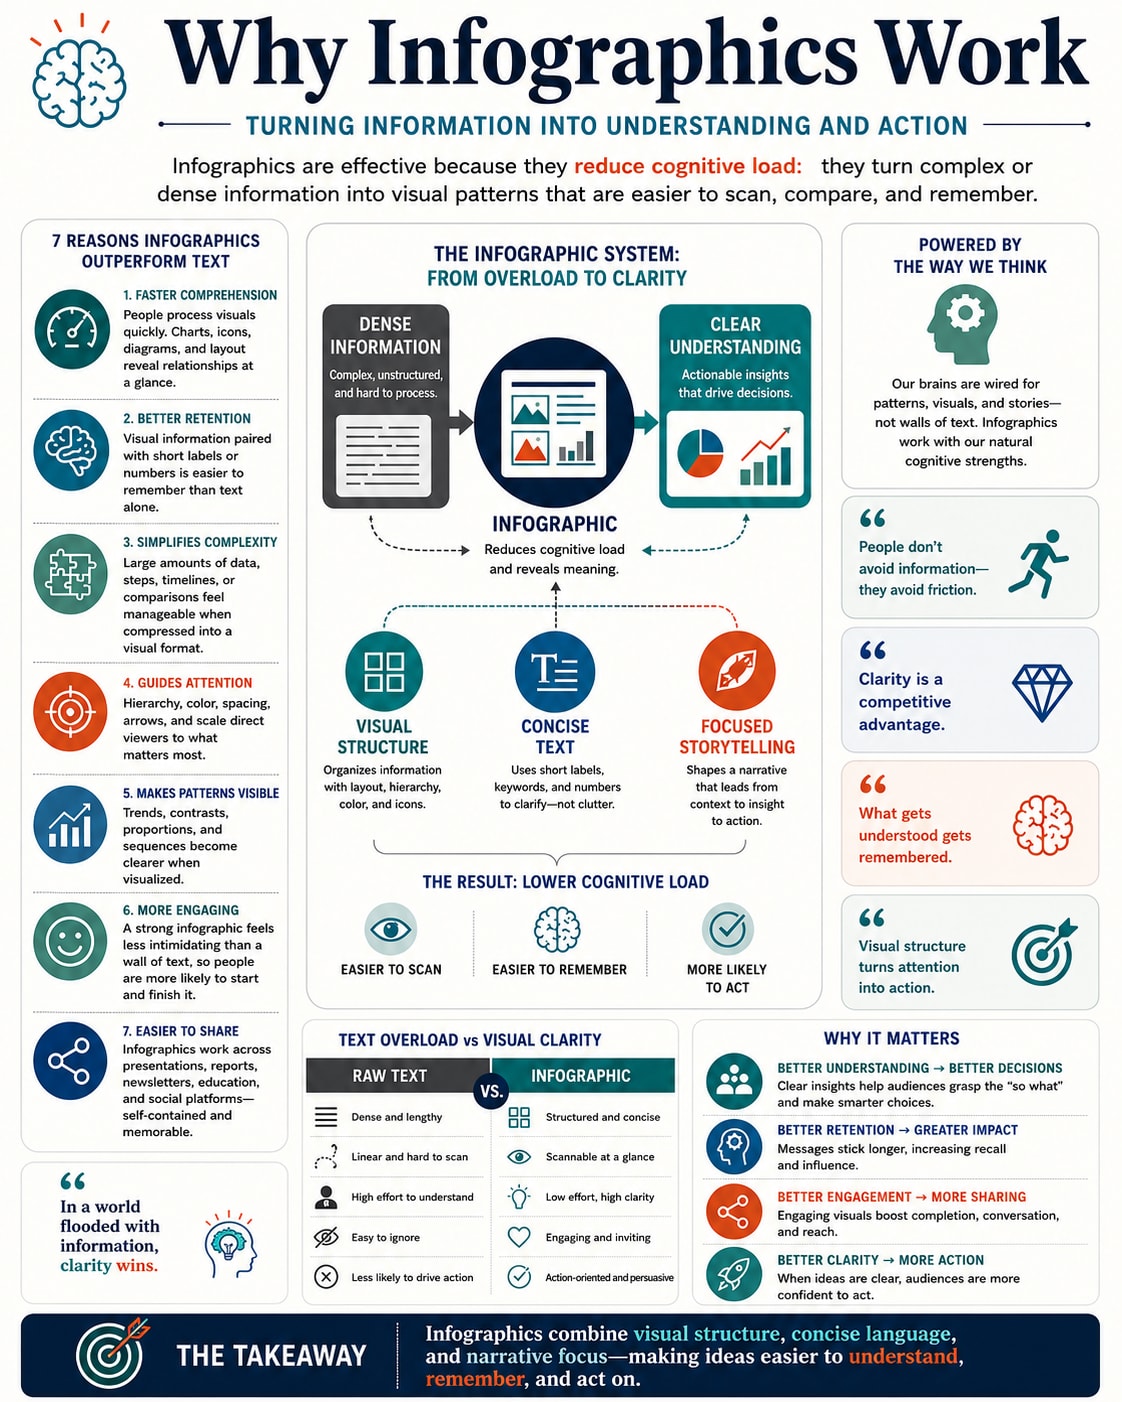
Infographics work because they reduce cognitive load — dense information becomes visual patterns that are easier to scan, compare, and remember. That's not a design opinion; it's how brains process the world. And it's the foundation everything we build stands on.
Seven reasons visuals beat walls of text
Every one of these compounds in your favor when the visual carries your brand.
Faster comprehension
People process visuals in a glance. Charts, icons, and layout reveal relationships without paragraphs of explanation.
Better retention
Visual information paired with concise labels and numbers sticks — long after prose has faded.
Simplifies complexity
Data, steps, timelines, and comparisons compress into a form that feels manageable instead of intimidating.
Guides attention
Size, color, spacing, and hierarchy walk the eye to what matters most — in the order it matters.
Makes patterns visible
Trends, proportions, and contrasts that hide in paragraphs become obvious in visual form.
More engaging
A strong infographic invites people in. They start it — and they finish it.
Easier to share
Self-contained and memorable, it travels: feeds, newsletters, presentations, group chats — carrying its maker's name.
Don't take our word for it — read the argument as one
This is the case above, made in the medium it argues for. Notice you'll finish it — and notice what you remember afterward.
So what does this mean if you make things?
Follow the chain. Each link is one of the seven reasons doing compound work for a creator:
That's what InfographicsPlus automates: every video you publish becomes a branded keeper — generated automatically, approved by you, delivered to the people who asked for it, and housed forever in a library that's unmistakably yours.